
Bitcoin Falls 12% Below 200-Week Average: Danger Signal or Turning Point?
Baca dalam 60 detik
- Penurunan mingguan 12,6% membawa Bitcoin melewati support krusial 200-week moving average, memicu kekhawatiran koreksi lebih dalam.
- Data historis menunjukkan pola serupa hanya terjadi tiga kali sejak 2013, dan semuanya berakhir dengan reli tiga bulan kemudian.
- Namun, rebound tidak instan: Bitcoin cenderung turun 10-17% lebih dulu sebelum berbalik naik, sejalan dengan proyeksi Wintermute.
Bitcoin posted a 12.6% weekly decline last week and closed just above the US$65,000 level, according to TradingView data. The drop pushed the price through the 200-week simple moving average (SMA), currently around US$68,000 — a level traders regard as both a long-term support and a momentum barometer. The fall below that average immediately raised concerns that the downtrend will deepen.
Those concerns are not unfounded. Analysts at crypto market maker Wintermute are among those wary of further declines. Current market data supports that cautious stance, especially with continued outflows from Bitcoin ETFs and rising bond yields. However, the historical record for weekly declines of 12% or more that break the 200-week SMA paints a different picture.
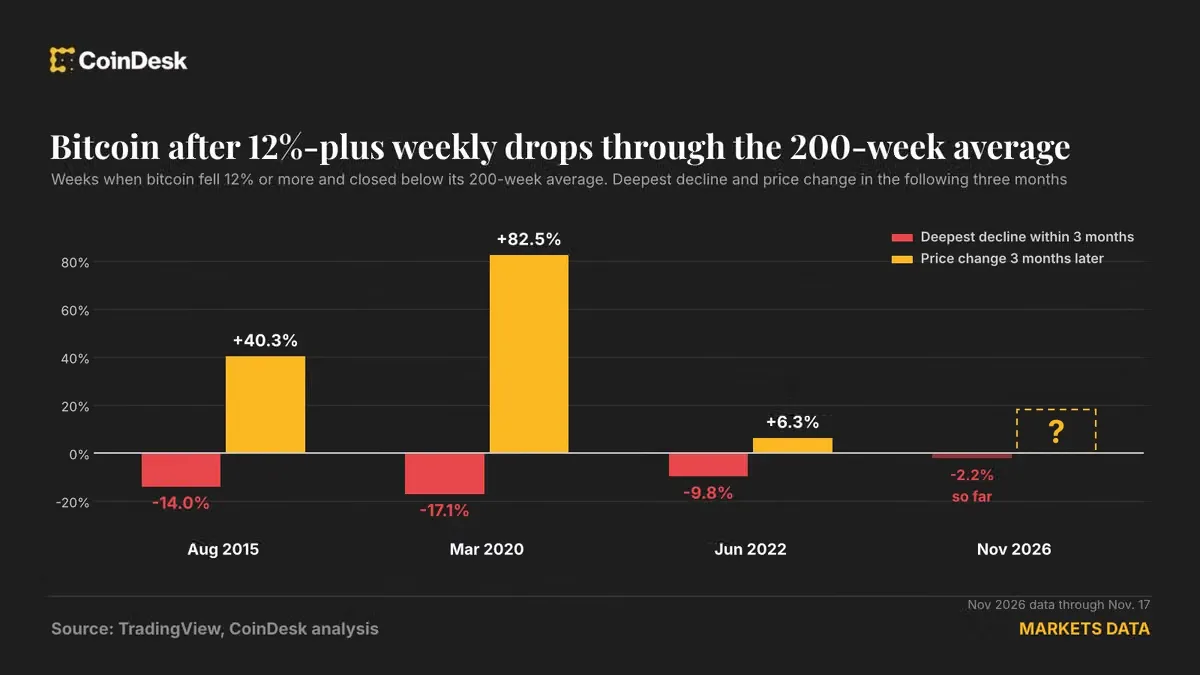
Since 2013 — when 200-week SMA data first became available — the combination of a weekly decline of ≥12% and a break of that level had occurred only three times before last week. In August 2015, Bitcoin weakened but then surged 40.3% over the following three months. After the March 2020 Covid crash, its price jumped 82.5% over the same period. Then in June 2022, Bitcoin gained only 6.3% over three months, and that rally fell apart after the FTX bankruptcy in November 2022, which took the price to around US$15,500.
Notably, the rebound never came instantly. In all three previous cases, Bitcoin first dropped 10-17% before finally reversing direction. If a similar pattern repeats from last week's closing level, the price could reach the US$54,000 to US$59,000 range — in line with Wintermute's projection of a price in the US$50,000s area.
The takeaway: a 12% crash that breaks the 200-week SMA tends to occur at the end of a bearish market, not at its beginning or middle. However, three examples are not enough to form a hard rule. Broader macroeconomic conditions remain the determining factor. Persistent ETF outflows and rising bond yields could keep Bitcoin under pressure for more than three months.
“The market is testing patience. Historically, this level has often been an accumulation point, but the macro context this time is different,” said a crypto analyst who declined to be named, referring to global uncertainty.
Moreover, large weekly declines are nothing new for Bitcoin. Since 2009, there have been 77 weeks with losses of 12% or more. However, the frequency has dropped sharply — only four weeks since early 2023. That means such extreme volatility is becoming rarer, even though its impact remains significant.
For Indonesian investors, this dynamic is worth watching. Bitcoin remains the most popular crypto asset in the country, and global price movements often influence local market sentiment. Nevertheless, domestic factors such as Bappebti regulation and the liquidity of the national crypto exchange also play a role. A sharp decline could be a momentum opportunity for long-term investors, but the risk of further declines in the coming weeks remains open.
Looking ahead, the question is whether the historical pattern will repeat: a 10-17% decline before a rally, or whether worsening macro conditions will prolong the bearish phase. With uncertainty around global interest rate policy and ETF flows, the next three months will be the real test of this “crash at the end of a bear market” thesis.